Pivot Points are a popular technical analysis tool used to analyze price movements in financial markets, including the Indian Stock Market. The Pivot Points Standard Indicator calculates a set of support and resistance levels based on the previous trading session’s high, low, and close prices. These levels can help traders identify potential areas of buying and selling interest, as well as determine potential price targets.
The calculation of Pivot Points involves the following levels:
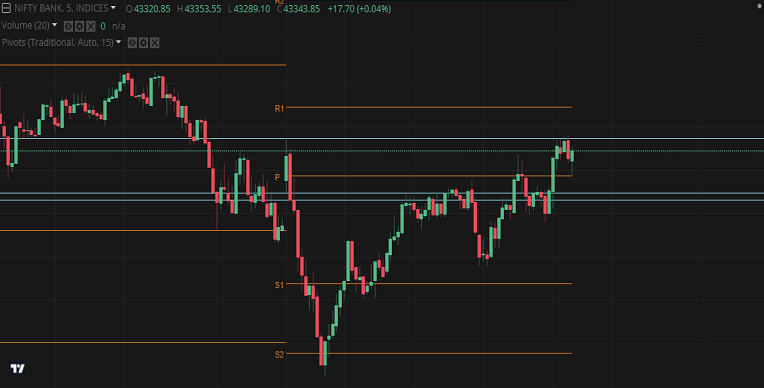
- Pivot Point (PP): It is the central reference point calculated as the average of the previous trading session’s high, low, and close prices.
- Support Levels (S1, S2, S3): These levels are considered as potential areas of support or buying interest. They are calculated based on the Pivot Point and the previous session’s high and low prices. The formula to calculate support levels is as follows:
- S1 = (2 x PP) – High of the previous session
- S2 = PP – (High – Low) of the previous session
- S3 = Low of the previous session – 2 x (High – PP)
- Resistance Levels (R1, R2, R3): These levels are considered as potential areas of resistance or selling interest. They are calculated based on the Pivot Point and the previous session’s high and low prices. The formula to calculate resistance levels is as follows:
- R1 = (2 x PP) – Low of the previous session
- R2 = PP + (High – Low) of the previous session
- R3 = High of the previous session + 2 x (PP – Low)
Traders use these Pivot Points and associated support and resistance levels to make trading decisions. Here are some common strategies and interpretations:
- Bounces: Traders look for price bounces off the support or resistance levels. If the price approaches a support level and shows signs of reversing, it may be considered a potential buying opportunity. Conversely, if the price approaches a resistance level and shows signs of reversing, it may be considered a potential selling opportunity.
- Breakouts: Traders observe price movements that break through support or resistance levels. A breakout above a resistance level may suggest further upward movement, while a breakout below a support level may suggest further downward movement. Traders often use additional indicators or confirmation signals to validate breakouts.
- Range-bound markets: When the price is trading within a range, traders may use the support and resistance levels to identify potential entry and exit points. They may consider buying near support and selling near resistance until the price breaks out of the range.
It’s important to note that Pivot Points are just one tool among many used in technical analysis. Traders often combine them with other indicators, such as moving averages, volume analysis, and trend lines, to make more informed trading decisions. Additionally, market conditions and other fundamental factors should also be considered in conjunction with technical analysis.